Plotting x-t data for Constant Acceleration
 This year I had students use Excel for plotting graphs in physics. I went pretty good for constant velocity but very awkward for constant acceleration. It required students to manually find tangent lines on their x-t graphs, calculate slopes, then put it all together coherently to produce a v-t graph. There are lots of things going on in this task and while I think many physics teachers see value in this, I also think that performing all the manual steps the confounds foundation ideas in the constant acceleration model.
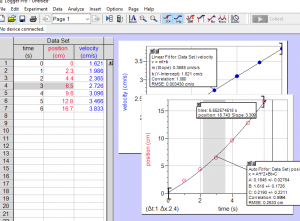
Modeling instruction strongly encourages using probeware and computers to analyze data, and working through labs like constant acceleration and a net force lab (half Atwood device), it’s easy to see why. I don’t have probeware but I am able to purchase a license for Logger Pro from Vernier. So today I downloaded the demo for Logger Pro and checked out what is possible for manual data entry and graphing.
In a nutshell, I found Logger Pro very easy to use. I quickly added position and time data and was given a graph with a parabola on it. One nice thing about the software is that the graphing is happening as you enter in the data. A few more mouse clicks gave me the parabola for the best fit line. Next I created a new column for velocity. I then grabbed the tanget tool, which read out the slope of the tangent line as I moved the cursor along the curve. This allowed me to record different values of the tangent slope at different times. Next I added a second graph showing velocity vs time. Finally I added a linear fit, which gave me the model for the motion including the slope of the graph which is acceleration. So easy!