Holistic vs Calculated Grading
The Task
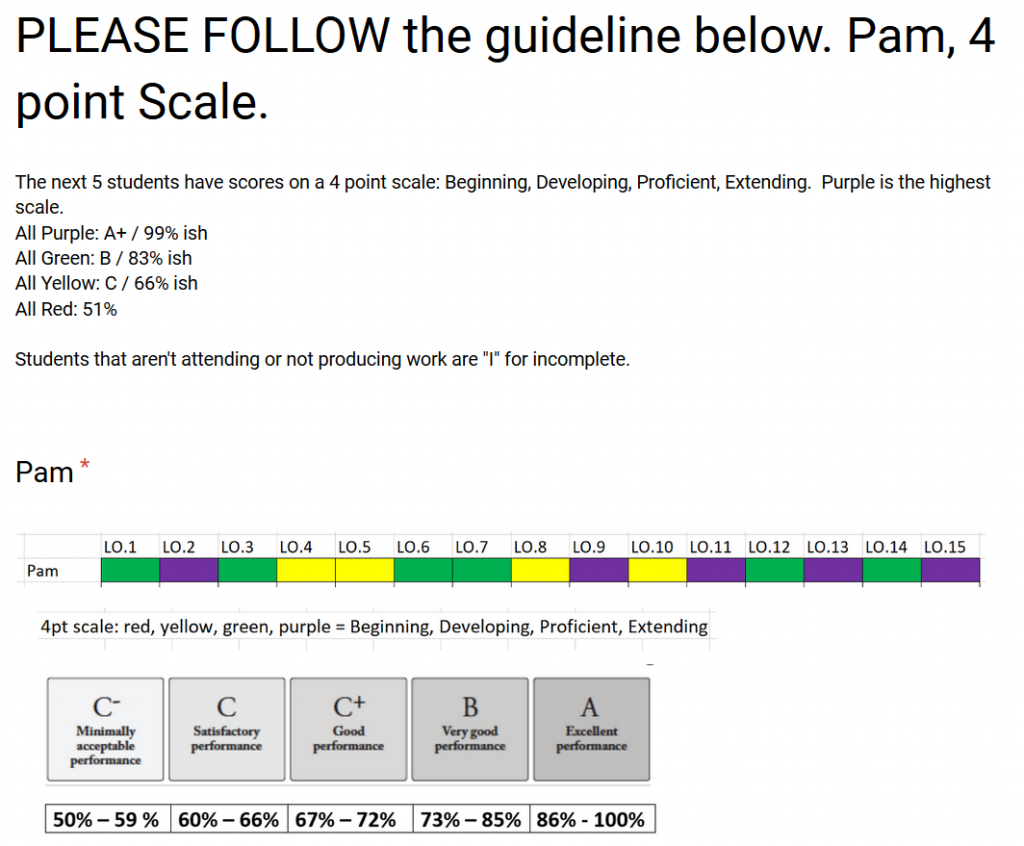
I recently sent out a survey to Twitter where 50 respondents were presented with series of scores for students. The scores were for individual learning objectives and all the scores are based on a 3 point or 4 point proficiency scale. Each score was indicated by one of four different colours. Users were asked to come up with an overall letter grade and percent for each student based on these learning objective scores. Some guidance was given to the user to ensure that everyone would have a common understanding on what each colour meant. Below is an example of scores for a student.
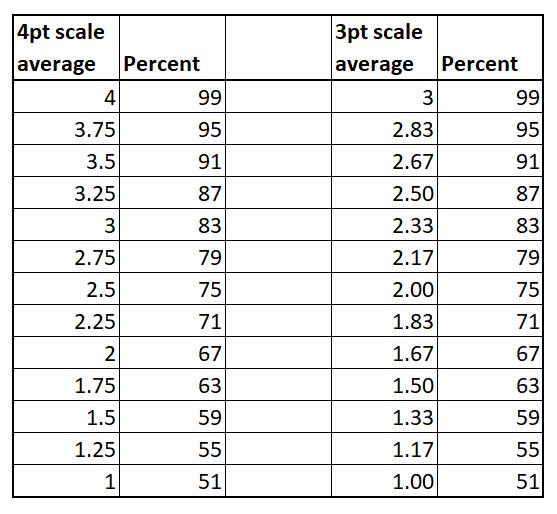
The main reason I was interested in doing this survey was to find out how consistent teachers can be when grading holistically, and how close their holistic grade would be compared to a calculated grade. For example, a 4 point scale like the one shown above can be averaged and converted to a percent by assigning a 1 to red, a 2 to yellow, a 3 to green and a 4 to purple and then averaging these point. This average can then be converted to a percent using the table below.
For Pam, she had an average of (4x2 + 6x3 + 5x4)/15 = 3.07. This converts to an overall calculated grade of 83%.
The Results
First let’s look at the overall grade results for Erika. Erik’s score results were:
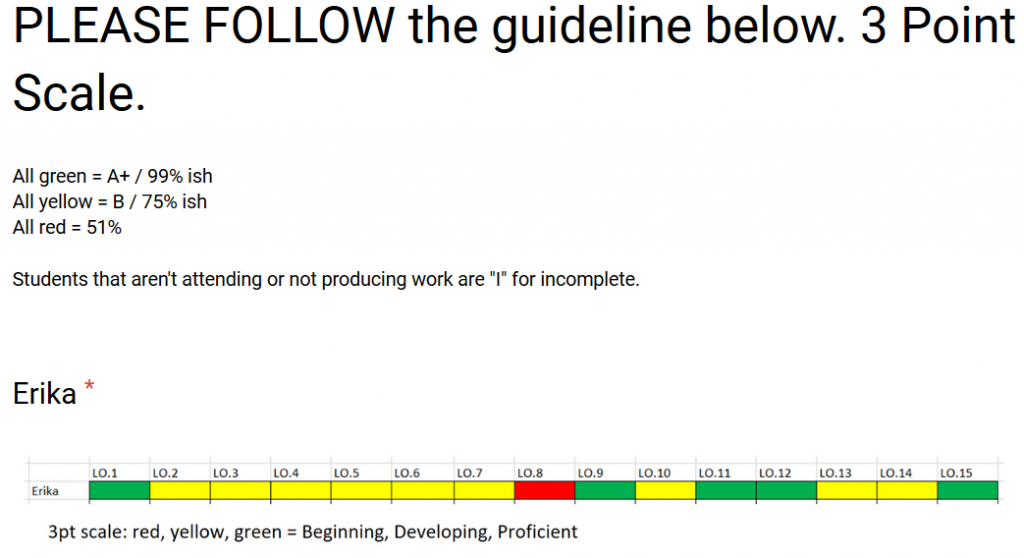
Holistic grading results from 49 users are below.
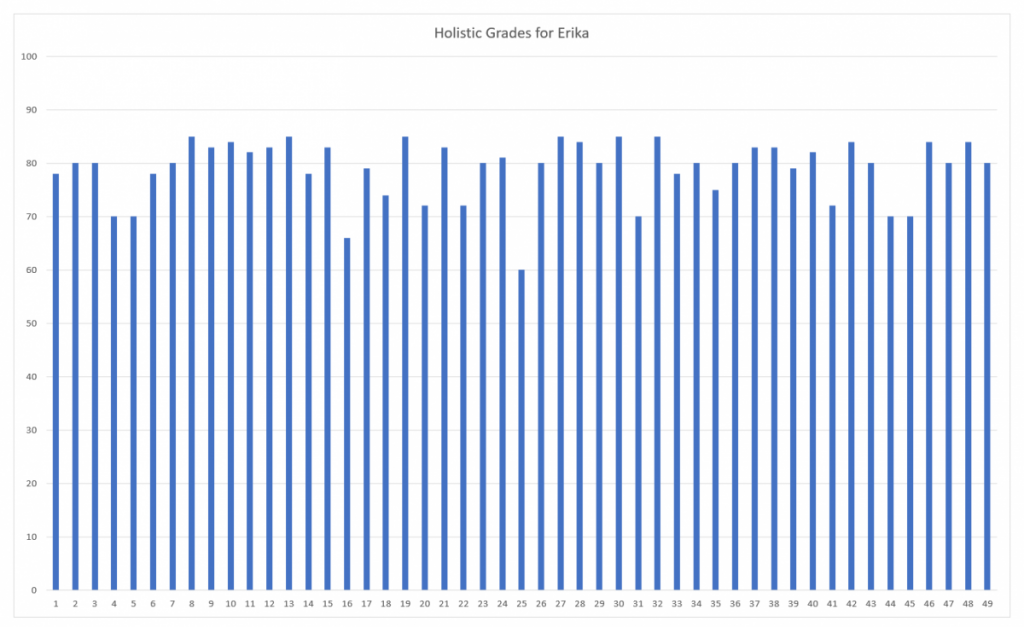
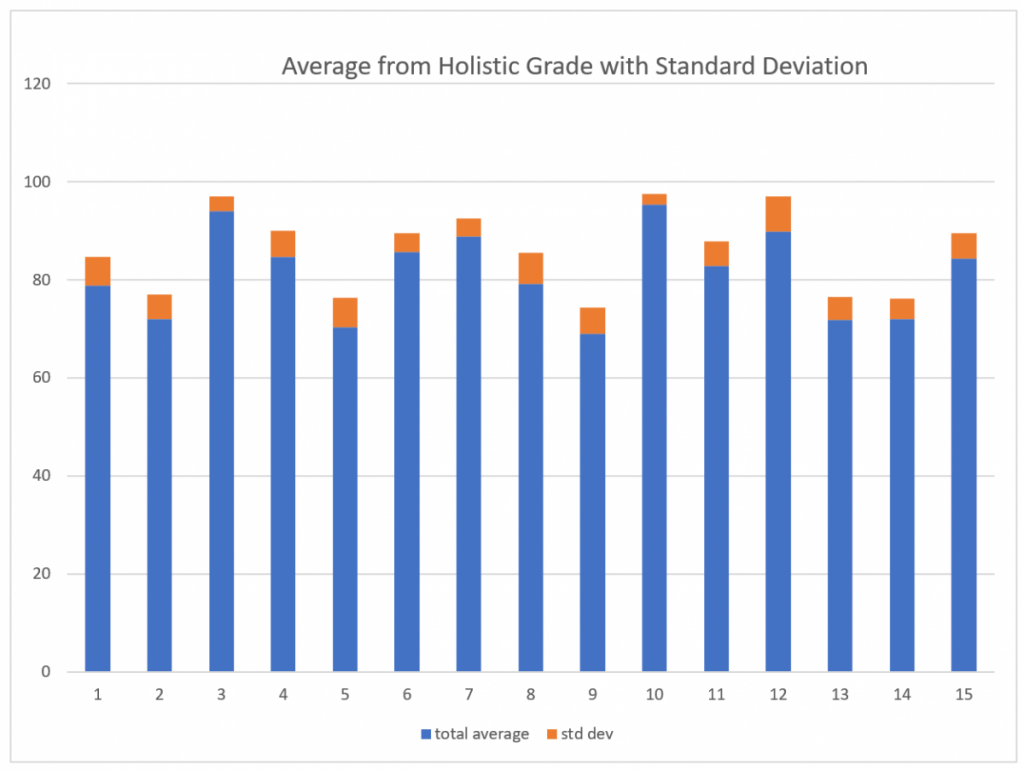
The overall average for Erika’s holistic grading was 79% with a standard deviation of 5.7%.
The graph below shows the average and standard deviation for each of the 15 students analyzed. The standard deviation is quite consistent across all students. The average standard deviation for students rated on a 3pt scale was 4.9%, for a 4pt scale it was 4.5%, and for a mixed 3pt/4pt scale it was 5.2%.
Next I looked at how the average holistic rating compared to the calculated average.
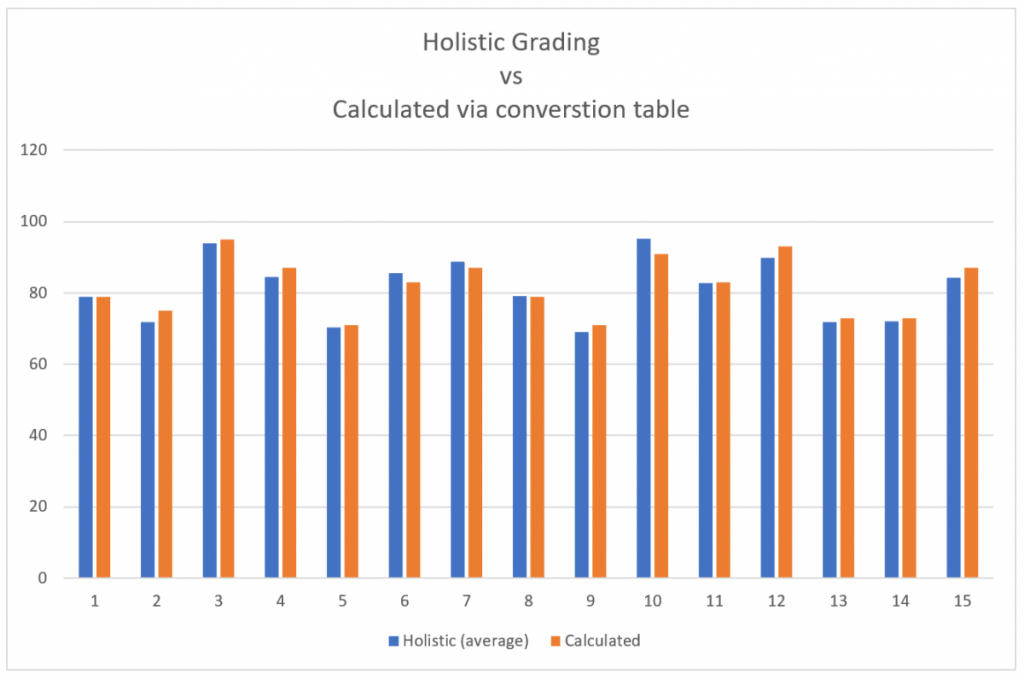
These results were very close. The average percent difference between a holistic grade and a calculated grade was only 2.1%
Summary
Overall I would say that on average, a person is able to holistically choose an overall grade that matches a calculated grade. This is important when you consider how a calculated grade was created in this task: an average was found from individual learning objective scores and then this average was compared to a conversion chart. Here in Vancouver most teachers use the gradebook that is included with our SIS, “MyEducation”, and this gradebook is not able to calculate a grade in this manner. Therefore, if a teacher wants to use a proficiency scale where the first level (1, red) equates to a 50%, the gradebook will not be able to calculate a correct average. What this survey tells us is that we can have confidence that a teacher does not need to use a calculated average, and that a grade determined holistically will give the same results.
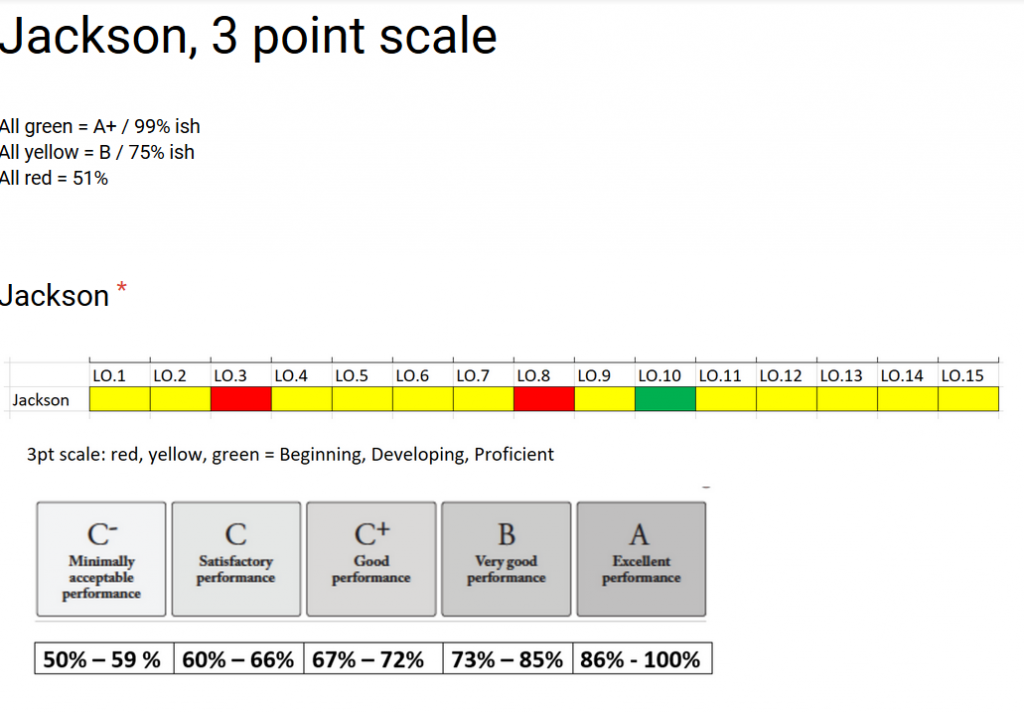
However, for any given student there was a relatively wide range of holistic grades, even if the average closely matches the grade. I’m convinced this standard deviation can be greatly lowered with training. For example, consider Jackson’s score results below. With a bit of training, a teacher should see that mostly yellow gives a grade of 75%. Jackson mostly has yellow with one green that mostly balances out with two red. Jackson should probably be given a grade close to 75%, yet two survey results gave Jackson a holistic grade of 50% and 55%. Clearly these grades are two low and I bet that the person was thinking that red is 0, yellow is 50% and red is 100%.
Using a survey like the one presented here not only informs on how well teachers can create a holistic grade, but it can also be used to help with training teachers and calibrating their grading ability to an agreed upon scale. Whether a person would want to use this holistic grading, that’s another question. I wonder how well this process scales? Would it be harder to choose a grade if a person was evaluating 40 learning objectives instead of 15? What if you can’t visually see all 40 learning objectives on the same screen or sheet at once? I don’t actually think it’s a good idea to have 40 discrete learning objectives, but these are the types of questions that need to be considered prior to deployment.